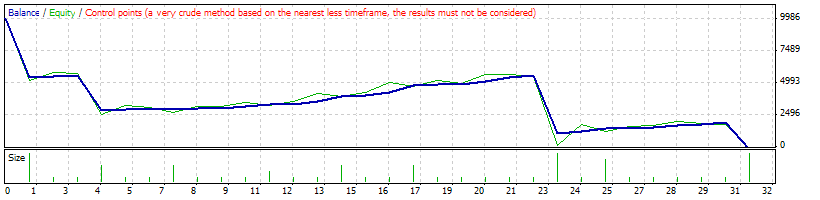
Strategy Tester Report
MA cross with take profit levels 4
AlpariUK-Demo (Build 225)
| Symbol | USDCAD (US Dollar vs Canadian Dollar) | ||||
| Period | 1 Hour (H1) 2009.01.05 17:00 - 2009.12.31 18:00 (2009.01.01 - 2010.01.01) | ||||
| Model | Control points (a very crude method, the results must not be considered) | ||||
| Parameters | str1="""; TakeProfit=1000; profitTarget1=21; profitTarget2=34; profitTarget3=55; profitTarget4=89; Stoploss=1000; TrailingStop=100; TrailingStopOnlyProfit=true; TrailingStopRegular=false; Lots=5; str2="""; emaOPENperiods=5; emaCLOSEperiods=5; str3="""; | ||||
| Bars in test | 6211 | Ticks modelled | 152607 | Modelling quality | n/a |
| Mismatched charts errors | 70 | ||||
| Initial deposit | 10000.00 | ||||
| Total net profit | -10304.40 | Gross profit | 3750.39 | Gross loss | -14054.79 |
| Profit factor | 0.27 | Expected payoff | -332.40 | ||
| Absolute drawdown | 10304.40 | Maximal drawdown | 10304.40 (103.04%) | Relative drawdown | 103.04% (10304.40) |
| Total trades | 31 | Short positions (won %) | 20 (90.00%) | Long positions (won %) | 11 (81.82%) |
| Profit trades (% of total) | 27 (87.10%) | Loss trades (% of total) | 4 (12.90%) | ||
| Largest | profit trade | 505.54 | loss trade | -4572.80 | |
| Average | profit trade | 138.90 | loss trade | -3513.70 | |
| Maximum | consecutive wins (profit in money) | 18 (2769.10) | consecutive losses (loss in money) | 1 (-4572.80) | |
| Maximal | consecutive profit (count of wins) | 2769.10 (18) | consecutive loss (count of losses) | -4572.80 (1) | |
| Average | consecutive wins | 9 | consecutive losses | 1 | |
| # | Time | Type | Order | Size | Price | S / L | T / P | Profit | Balance |
| 1 | 2009.01.05 17:00 | sell | 1 | 5.00 | 1.18720 | 1.19809 | 1.17720 | ||
| 2 | 2009.01.06 08:50 | s/l | 1 | 5.00 | 1.19809 | 1.19809 | 1.17720 | -4544.13 | 5455.87 |
| 3 | 2009.01.06 08:50 | buy | 2 | 5.00 | 1.19874 | 1.18785 | 1.20874 | ||
| 4 | 2009.01.06 09:20 | close | 2 | 1.00 | 1.19968 | 1.18785 | 1.20874 | 78.35 | 5534.22 |
| 5 | 2009.01.06 09:20 | buy | 3 | 4.00 | 1.19874 | 1.18785 | 1.20874 | ||
| 6 | 2009.01.06 09:25 | close | 3 | 1.00 | 1.19925 | 1.18785 | 1.20874 | 42.53 | 5576.75 |
| 7 | 2009.01.06 09:25 | buy | 4 | 3.00 | 1.19874 | 1.18785 | 1.20874 | ||
| 8 | 2009.01.06 11:15 | s/l | 4 | 3.00 | 1.18785 | 1.18785 | 1.20874 | -2753.06 | 2823.69 |
| 9 | 2009.01.06 11:15 | sell | 5 | 5.00 | 1.18668 | 1.19757 | 1.17668 | ||
| 10 | 2009.01.06 11:20 | modify | 5 | 5.00 | 1.18668 | 1.18667 | 1.17668 | ||
| 11 | 2009.01.06 11:20 | close | 5 | 1.00 | 1.18567 | 1.18667 | 1.17668 | 85.18 | 2908.87 |
| 12 | 2009.01.06 11:20 | sell | 6 | 4.00 | 1.18668 | 1.18667 | 1.17668 | ||
| 13 | 2009.01.06 11:25 | close | 6 | 1.00 | 1.18614 | 1.18667 | 1.17668 | 45.53 | 2954.40 |
| 14 | 2009.01.06 11:25 | sell | 7 | 3.00 | 1.18668 | 1.18667 | 1.17668 | ||
| 15 | 2009.01.06 11:27 | s/l | 7 | 3.00 | 1.18667 | 1.18667 | 1.17668 | 2.53 | 2956.93 |
| 16 | 2009.01.06 11:27 | sell | 8 | 5.00 | 1.18668 | 1.19757 | 1.17668 | ||
| 17 | 2009.01.06 11:27 | close | 8 | 1.00 | 1.18629 | 1.19757 | 1.17668 | 32.88 | 2989.81 |
| 18 | 2009.01.06 11:27 | sell | 9 | 4.00 | 1.18668 | 1.19757 | 1.17668 | ||
| 19 | 2009.01.06 11:37 | close | 9 | 1.00 | 1.18629 | 1.19757 | 1.17668 | 32.88 | 3022.69 |
| 20 | 2009.01.06 11:37 | sell | 10 | 3.00 | 1.18668 | 1.19757 | 1.17668 | ||
| 21 | 2009.01.06 14:20 | modify | 10 | 3.00 | 1.18668 | 1.18597 | 1.17668 | ||
| 22 | 2009.01.06 14:20 | close | 10 | 1.00 | 1.18497 | 1.18597 | 1.17668 | 144.31 | 3167.00 |
| 23 | 2009.01.06 14:20 | sell | 11 | 2.00 | 1.18668 | 1.18597 | 1.17668 | ||
| 24 | 2009.01.06 14:22 | s/l | 11 | 2.00 | 1.18597 | 1.18597 | 1.17668 | 119.73 | 3286.73 |
| 25 | 2009.01.06 14:22 | sell | 12 | 5.00 | 1.18517 | 1.19606 | 1.17517 | ||
| 26 | 2009.01.06 14:45 | close | 12 | 1.00 | 1.18461 | 1.19606 | 1.17517 | 47.27 | 3334.00 |
| 27 | 2009.01.06 14:45 | sell | 13 | 4.00 | 1.18517 | 1.19606 | 1.17517 | ||
| 28 | 2009.01.06 14:50 | modify | 13 | 4.00 | 1.18517 | 1.18359 | 1.17517 | ||
| 29 | 2009.01.06 14:50 | close | 13 | 1.00 | 1.18259 | 1.18359 | 1.17517 | 218.17 | 3552.17 |
| 30 | 2009.01.06 14:50 | sell | 14 | 3.00 | 1.18517 | 1.18359 | 1.17517 | ||
| 31 | 2009.01.06 14:52 | s/l | 14 | 3.00 | 1.18359 | 1.18359 | 1.17517 | 400.47 | 3952.64 |
| 32 | 2009.01.06 14:52 | sell | 15 | 5.00 | 1.18271 | 1.19360 | 1.17271 | ||
| 33 | 2009.01.06 15:15 | close | 15 | 1.00 | 1.18209 | 1.19360 | 1.17271 | 52.45 | 4005.09 |
| 34 | 2009.01.06 15:15 | sell | 16 | 4.00 | 1.18271 | 1.19360 | 1.17271 | ||
| 35 | 2009.01.06 15:20 | modify | 16 | 4.00 | 1.18271 | 1.18072 | 1.17271 | ||
| 36 | 2009.01.06 15:20 | close | 16 | 1.00 | 1.17972 | 1.18072 | 1.17271 | 253.45 | 4258.54 |
| 37 | 2009.01.06 15:20 | sell | 17 | 3.00 | 1.18271 | 1.18072 | 1.17271 | ||
| 38 | 2009.01.06 15:22 | s/l | 17 | 3.00 | 1.18072 | 1.18072 | 1.17271 | 505.54 | 4764.08 |
| 39 | 2009.01.06 15:22 | sell | 18 | 5.00 | 1.18002 | 1.19091 | 1.17002 | ||
| 40 | 2009.01.06 15:50 | close | 18 | 1.00 | 1.17905 | 1.19091 | 1.17002 | 82.27 | 4846.35 |
| 41 | 2009.01.06 15:50 | sell | 19 | 4.00 | 1.18002 | 1.19091 | 1.17002 | ||
| 42 | 2009.01.06 15:53 | close | 19 | 1.00 | 1.17959 | 1.19091 | 1.17002 | 36.45 | 4882.80 |
| 43 | 2009.01.06 15:53 | sell | 20 | 3.00 | 1.18002 | 1.19091 | 1.17002 | ||
| 44 | 2009.01.06 15:59 | modify | 20 | 3.00 | 1.18002 | 1.17789 | 1.17002 | ||
| 45 | 2009.01.06 15:59 | close | 20 | 1.00 | 1.17689 | 1.17789 | 1.17002 | 265.96 | 5148.76 |
| 46 | 2009.01.06 15:59 | sell | 21 | 2.00 | 1.18002 | 1.17789 | 1.17002 | ||
| 47 | 2009.01.06 16:00 | close | 21 | 1.00 | 1.17692 | 1.17789 | 1.17002 | 263.40 | 5412.16 |
| 48 | 2009.01.06 16:00 | sell | 22 | 1.00 | 1.18002 | 1.17789 | 1.17002 | ||
| 49 | 2009.01.06 16:03 | s/l | 22 | 1.00 | 1.17789 | 1.17789 | 1.17002 | 180.63 | 5592.79 |
| 50 | 2009.01.06 16:03 | sell | 23 | 5.00 | 1.17827 | 1.18916 | 1.16827 | ||
| 51 | 2009.01.07 16:15 | s/l | 23 | 5.00 | 1.18916 | 1.18916 | 1.16827 | -4572.80 | 1019.99 |
| 52 | 2009.01.07 16:15 | buy | 24 | 5.00 | 1.19122 | 1.18033 | 1.20122 | ||
| 53 | 2009.01.07 16:20 | modify | 24 | 5.00 | 1.19122 | 1.19206 | 1.20122 | ||
| 54 | 2009.01.07 16:20 | close | 24 | 1.00 | 1.19306 | 1.19206 | 1.20122 | 154.23 | 1174.22 |
| 55 | 2009.01.07 16:20 | buy | 25 | 4.00 | 1.19122 | 1.19206 | 1.20122 | ||
| 56 | 2009.01.07 16:22 | s/l | 25 | 4.00 | 1.19206 | 1.19206 | 1.20122 | 282.06 | 1456.28 |
| 57 | 2009.01.07 16:22 | buy | 26 | 5.00 | 1.19213 | 1.18124 | 1.20213 | ||
| 58 | 2009.01.07 16:27 | close | 26 | 1.00 | 1.19241 | 1.18124 | 1.20213 | 23.48 | 1479.76 |
| 59 | 2009.01.07 16:27 | buy | 27 | 4.00 | 1.19213 | 1.18124 | 1.20213 | ||
| 60 | 2009.01.07 16:30 | close | 27 | 1.00 | 1.19261 | 1.18124 | 1.20213 | 40.25 | 1520.01 |
| 61 | 2009.01.07 16:30 | buy | 28 | 3.00 | 1.19213 | 1.18124 | 1.20213 | ||
| 62 | 2009.01.07 16:32 | modify | 28 | 3.00 | 1.19213 | 1.19290 | 1.20213 | ||
| 63 | 2009.01.07 16:32 | close | 28 | 1.00 | 1.19390 | 1.19290 | 1.20213 | 148.25 | 1668.26 |
| 64 | 2009.01.07 16:32 | buy | 29 | 2.00 | 1.19213 | 1.19290 | 1.20213 | ||
| 65 | 2009.01.07 16:35 | close | 29 | 1.00 | 1.19328 | 1.19290 | 1.20213 | 96.37 | 1764.63 |
| 66 | 2009.01.07 16:35 | buy | 30 | 1.00 | 1.19213 | 1.19290 | 1.20213 | ||
| 67 | 2009.01.07 16:37 | modify | 30 | 1.00 | 1.19213 | 1.19351 | 1.20213 | ||
| 68 | 2009.01.07 16:40 | s/l | 30 | 1.00 | 1.19351 | 1.19351 | 1.20213 | 115.77 | 1880.40 |
| 69 | 2009.01.07 16:40 | buy | 31 | 5.00 | 1.19294 | 1.18205 | 1.20294 | ||
| 70 | 2009.01.07 16:50 | close at stop | 31 | 5.00 | 1.18775 | 1.18205 | 1.20294 | -2184.80 | -304.40 |